More interesting than playing top trumps with headline figures, and certainly more useful is to do some analysis on the dyno output.
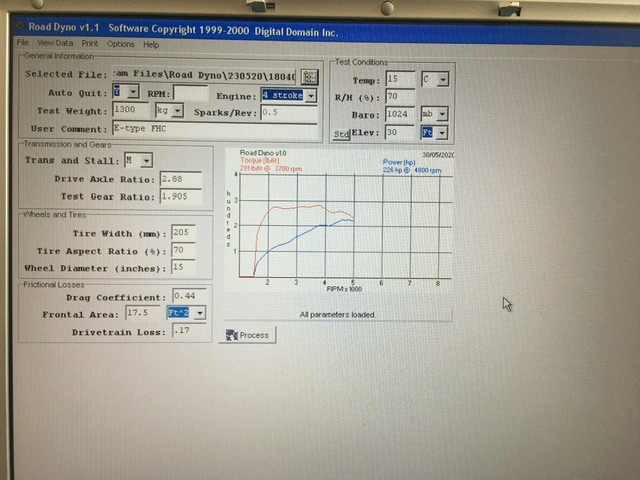
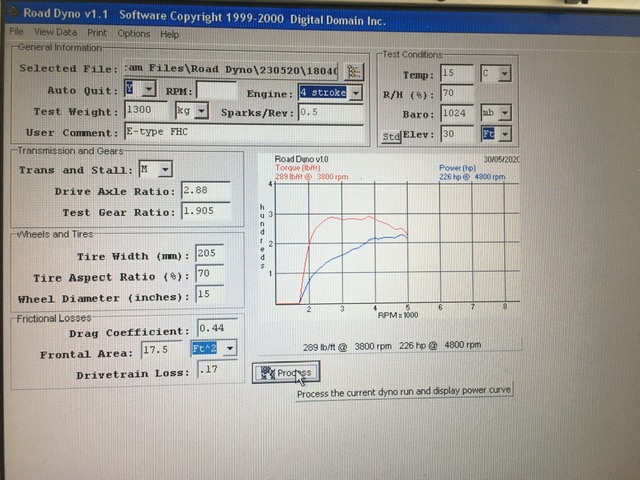
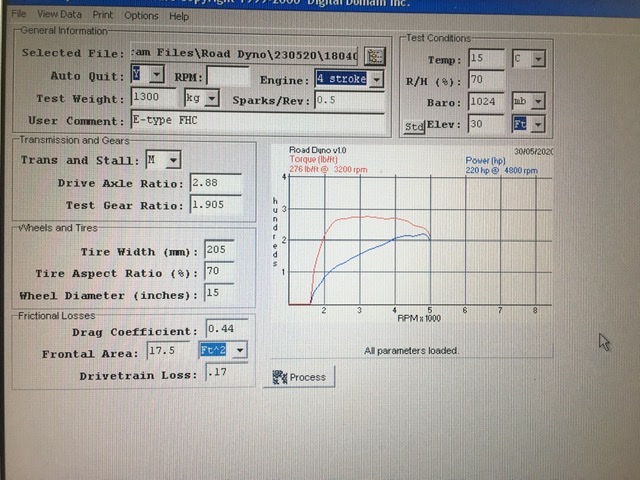
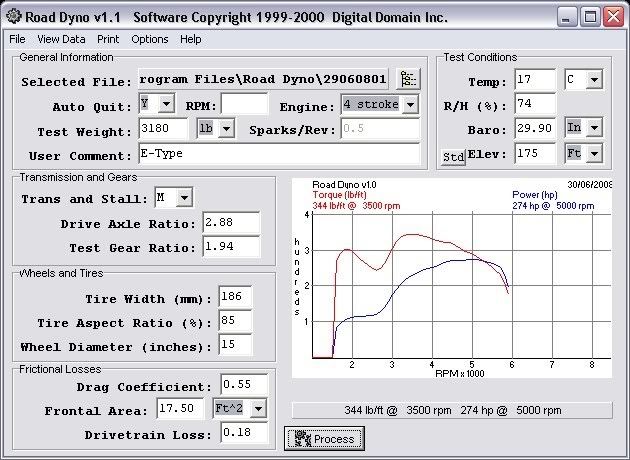
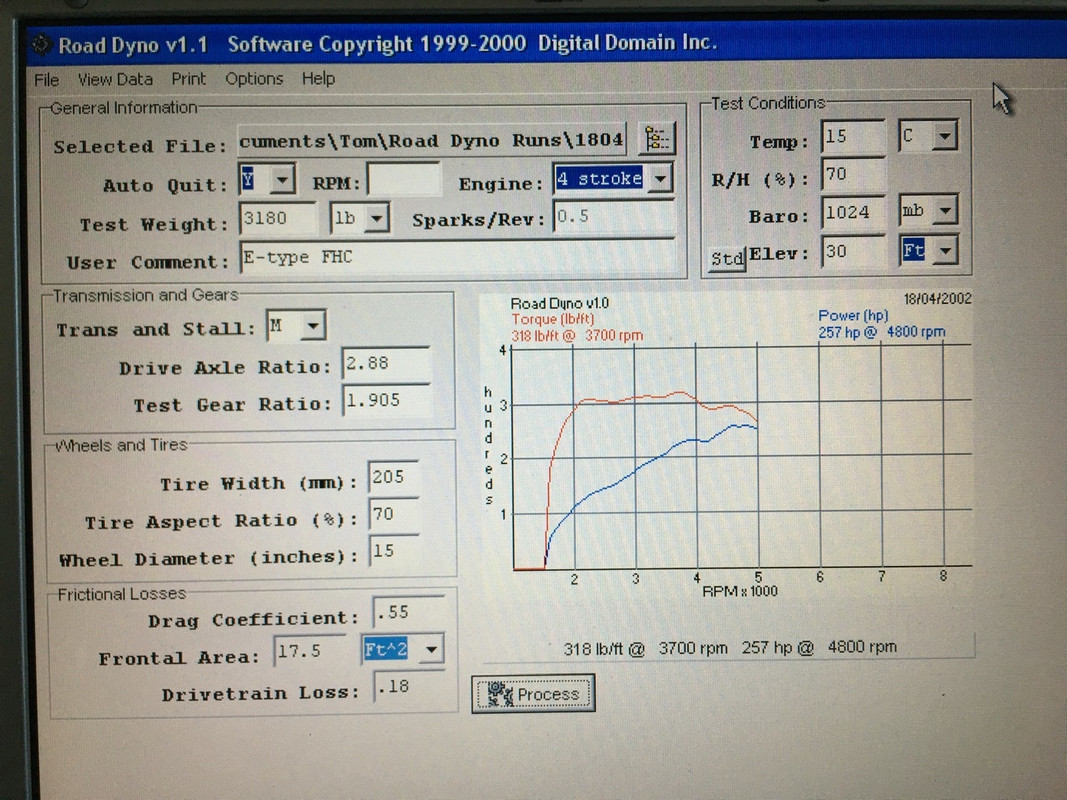
You need raw dyno data that can be entered into excel or similar, so you can draw your own dyno graph. This is mine from the data on my rolling road print out.

From there you can turn the torque curve into a series of graphs that show maximum tractive force available at the tyres in each gear.
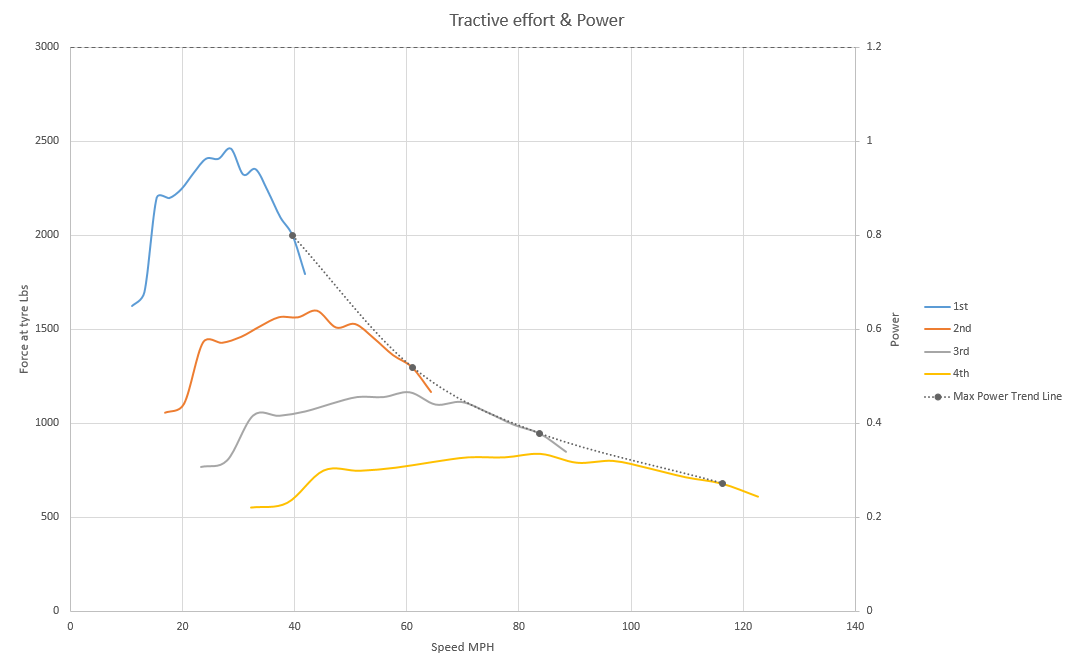
It can be seen from this, that on the E-type, that with with a large space between each gear, and a low rev limit, the maximum potential acceleration is always achieved in the lowest gear you can use for that speed. The dotted line shows the theoretical curve that joins the point on each curve where maximum power is made.
By viewing the data this way, we can see in where improvements in the torque curve will have most benefit to the maximum acceleration the car can achieve. In the case of my car, I’d benefit from smoothing the torque curve beyond the point of maximum torque, and improving the rev limit, to try and reduce the drop in tractive force experienced between gears. Anything that improves torque as a whole, and drags the whole curve up will be a benefit too. It’s apparent though, that any effort to only improve the torque curve before the point of peak torque will not benefit maximum potential acceleration, except for 1st gear, which is probably traction limited anyway.
This isn’t the whole picture though, as we don’t spend all our time driving around at wide open throttle, maximum revs and maximum acceleration. The shape of the curve at lower revs is very important to how the car feels on the road, more torque here will make the car accelerate more quickly for any given gear ratio. There’s a bit of work I could do here to smooth the curve slightly, but generally it’s very good. Decent torque from around 1750rpm all the way to 4000rpm, equates to the car pulling very well from 30 to over 70mph in 3rd. What can’t be viewed on the curves, but also makes a big difference to the feel of the car, is transient throttle response. This is essentially a measure of how quickly, on snapping the throttle open, the engine can get itself up to the torque curve.
The other useful thing that can be done by analysing the data this way is seeing what effect different gear ratios have.
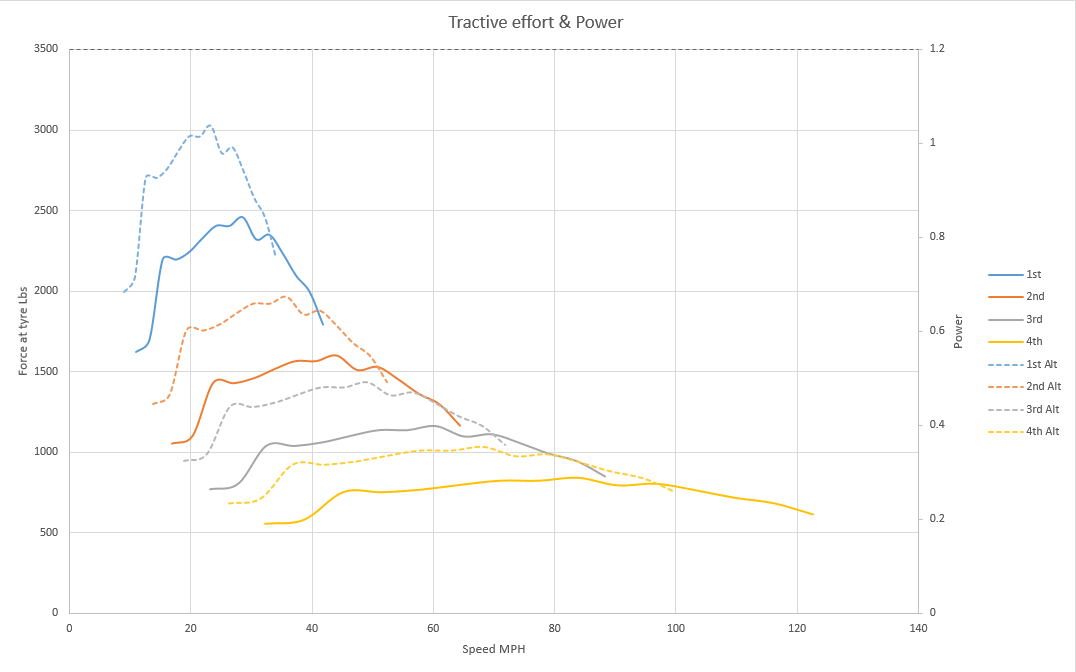
Here, I’ve overlayed the curves I would have were I still running the 3.54 diff in place of the 2.88 (dotted lines represent the 3.54). Interestingly, although the holes between adjacent gears have moved, the general trends follow the same curve. Where the 3.54 scores, is only in first, where the extra tractive effort is least useful. I suspect, though I’ve not tried it, that the 0-60 time will actually be better with the 2.88. The car will now do 60 In 2nd with the 2.88, so there’s now only one dip in the tractive effort curve to negotiate between 0-60, as well as the time saved from only having one gear change itself.
One final interesting point to note, is that my car will only make maximum power at 2 points within the legal speed limit, and maximum torque at 3 points (just).